Technical Indicators
Every indicator worth knowing - what it measures, how it is calculated, the canonical settings, the highest-leverage use case, and the failure mode the marketing copy never mentions.
Trend (4)
Identify the direction price is moving and filter out chop. Moving averages, ADX, parabolic SAR.
Momentum (5)
Measure the speed and force of recent price changes. Best for spotting exhaustion and divergence.
Volatility (3)
Quantify how much price is moving relative to its recent average. Drive stop sizing and breakout entries.
Volume (4)
Confirm or contradict price by asking whether real participation is behind the move.
Trend
Simple Moving Average
SMAThe arithmetic mean of closing prices over the lookback period. The simplest possible trend filter.
Exponential Moving Average
EMAA weighted average that gives recent prices more influence than older ones. Faster reaction than SMA, more whipsaws as a trade-off.
Average Directional Index
ADXThe strength of a trend without telling you direction. ADX reads 0 to 100 and answers one question: is this market trending or chopping?
Parabolic SAR
PSARThe point at which an existing trend is statistically likely to stop and reverse. SAR stands for stop and reverse.
Momentum
Relative Strength Index
RSIThe speed and magnitude of recent price changes on a 0-to-100 scale. High = recent buying pressure dominant, low = recent selling pressure dominant.
Moving Average Convergence Divergence
MACDThe relationship between two exponential moving averages. The histogram visualizes the gap between them - widening = momentum building, narrowing = momentum fading.
Stochastic Oscillator
Where the current close sits relative to the recent high-low range. If we are near the recent high, %K is near 100; near the low, near 0.
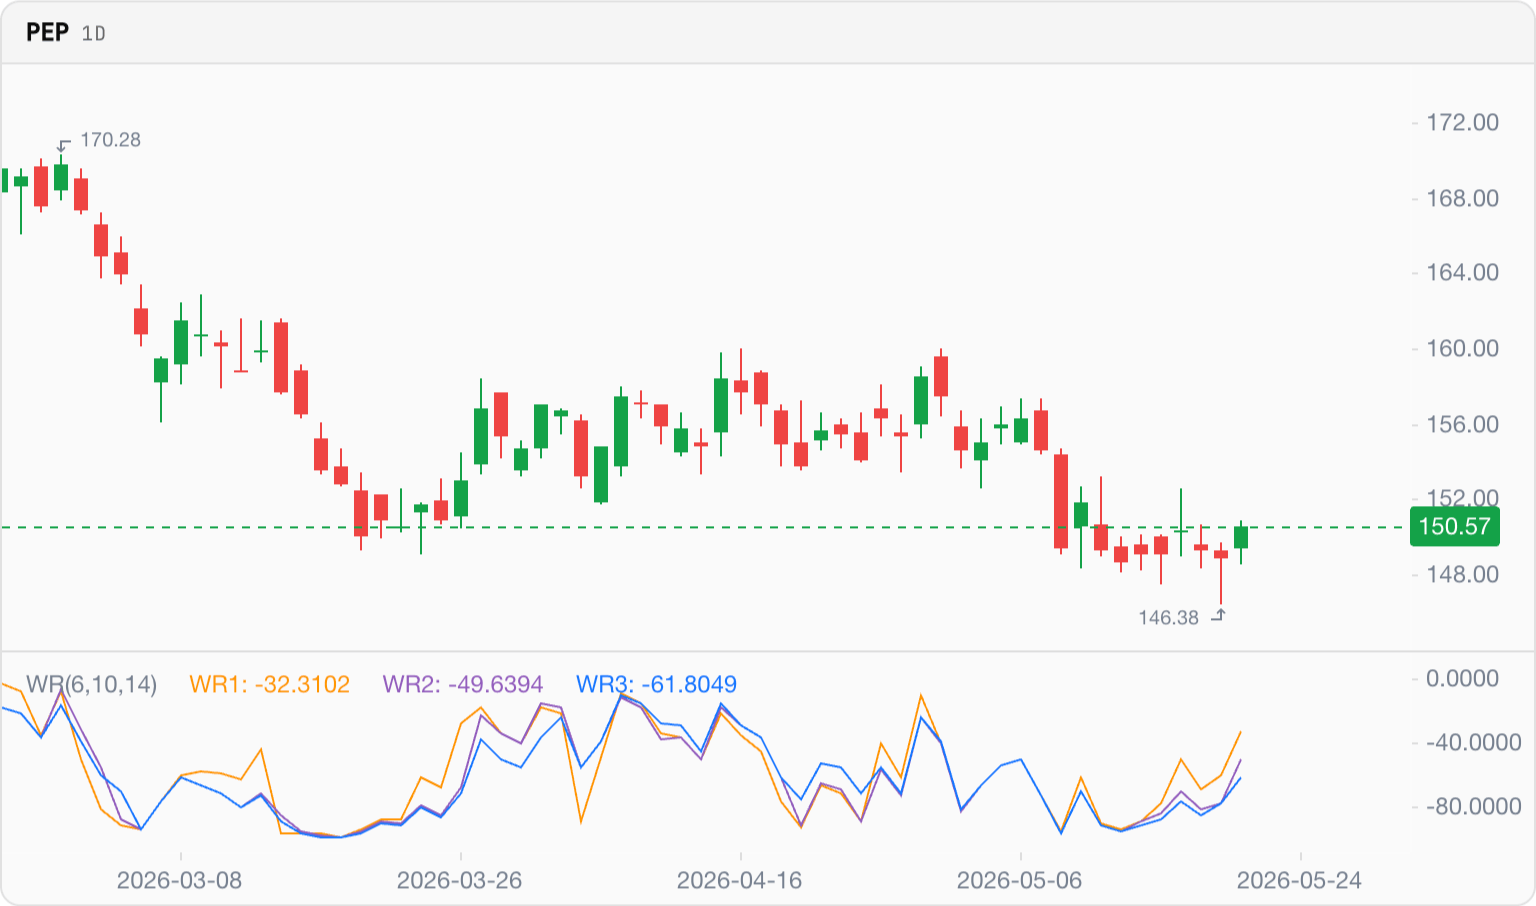
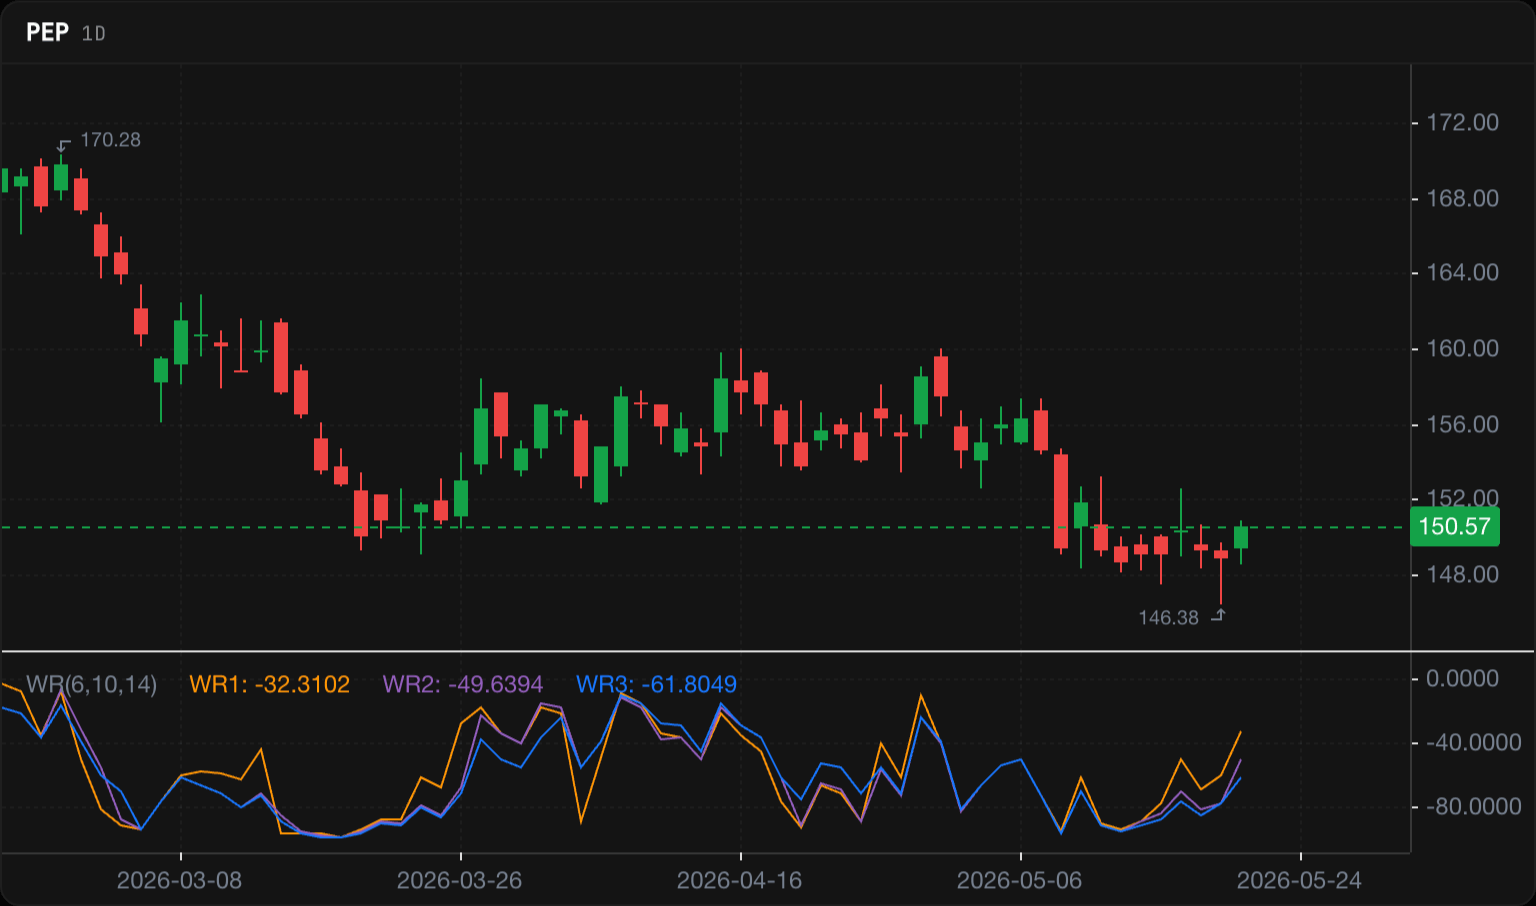
Williams %R
Effectively an inverted stochastic. Same calculation, scaled to -100 to 0 instead of 0 to 100, so the 'extreme' readings flip.
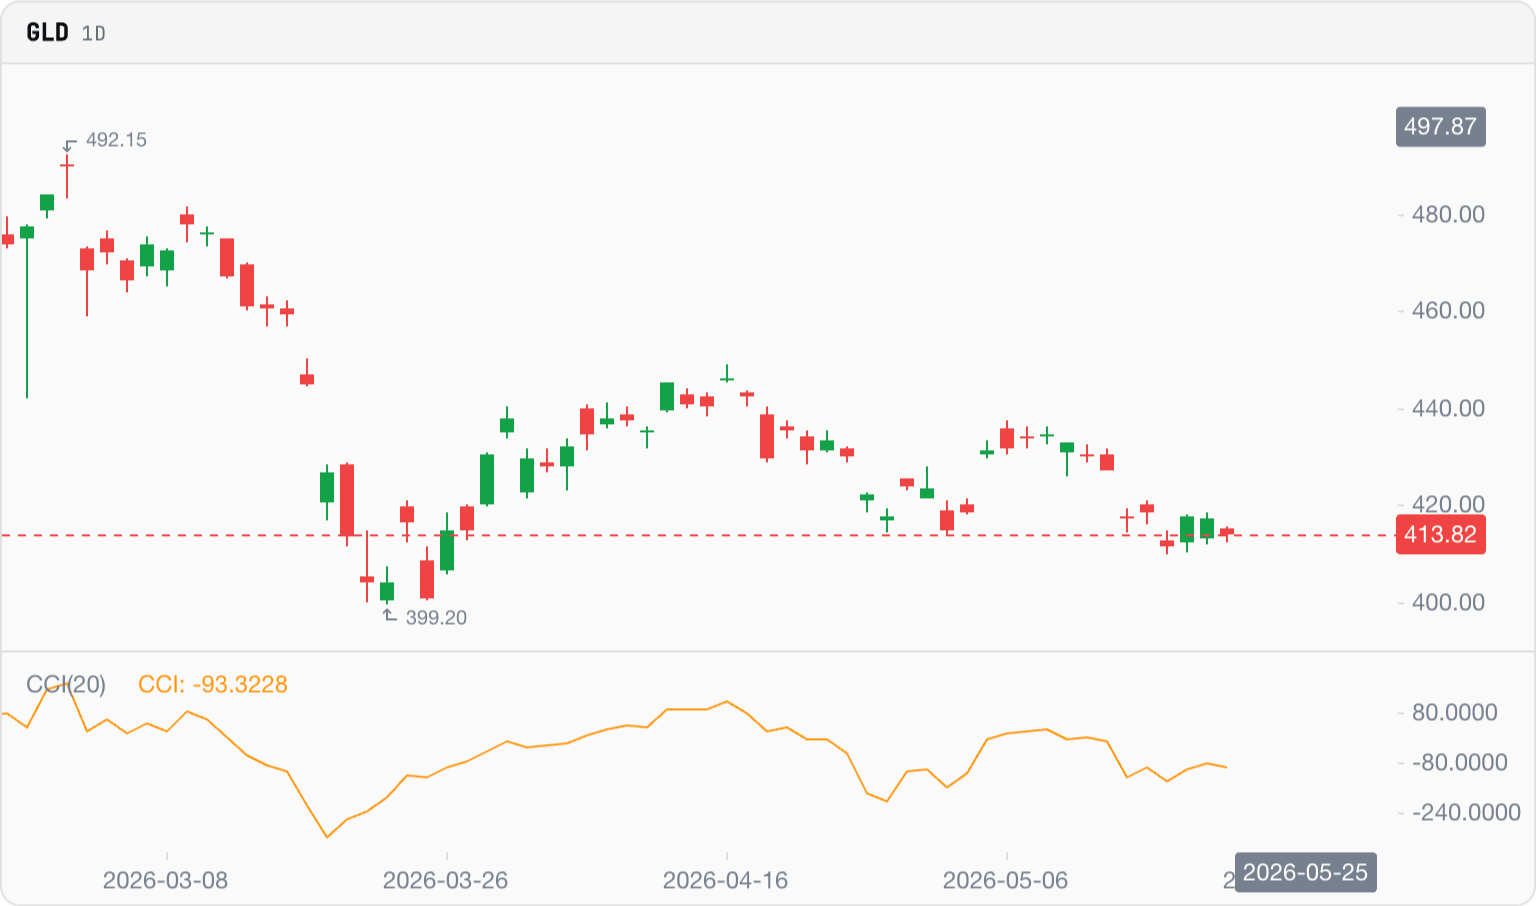
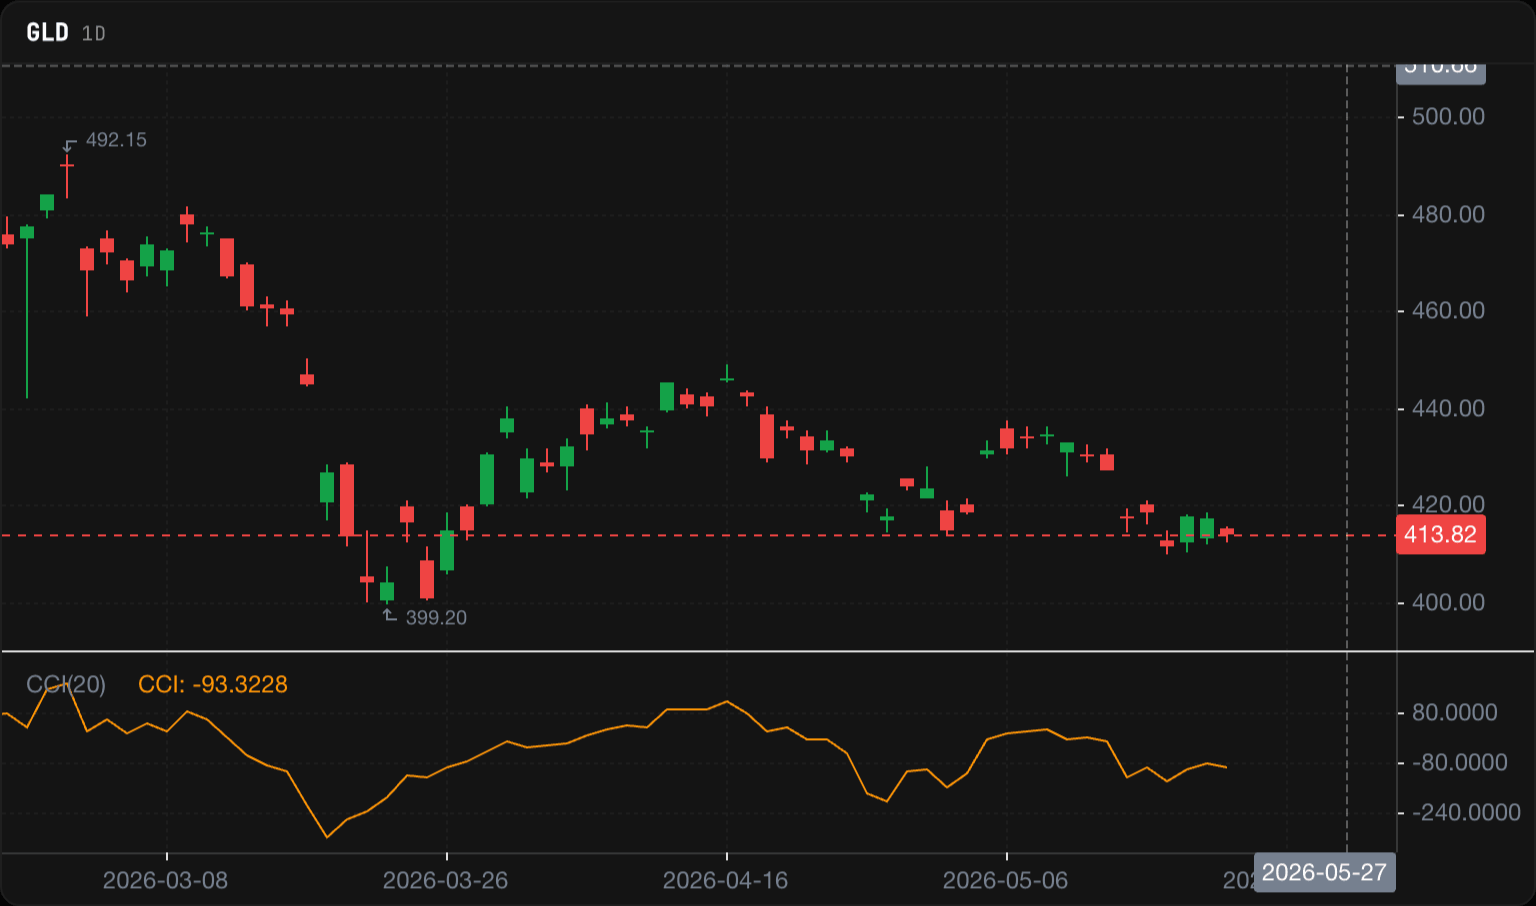
Commodity Channel Index
CCIHow far the current price has deviated from its statistical mean. Originally built for cyclical commodities; widely used across all asset classes today.
Volatility
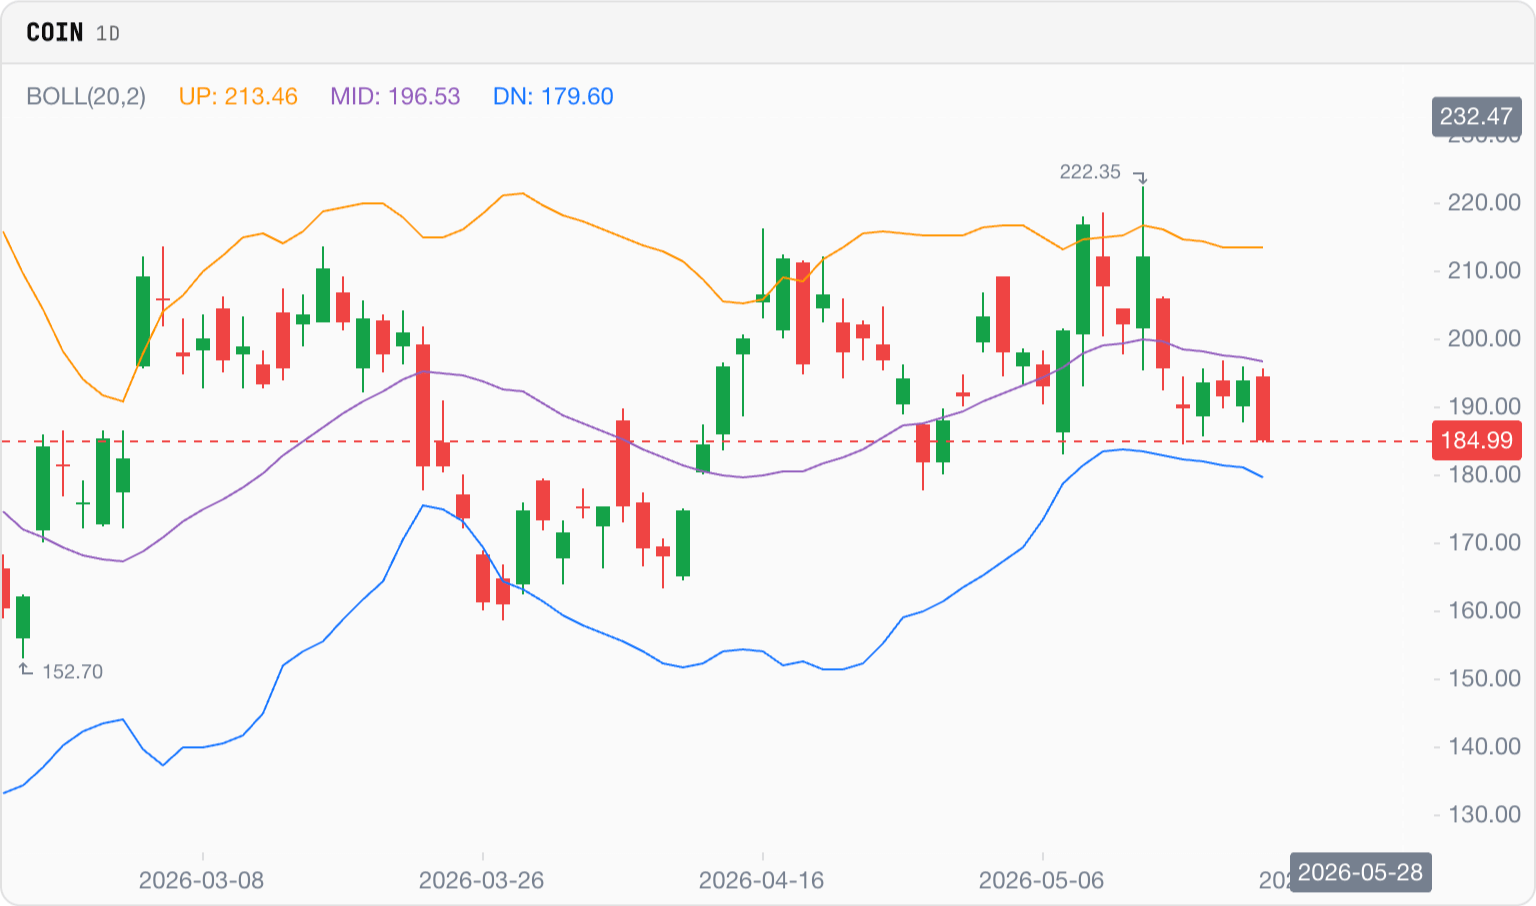
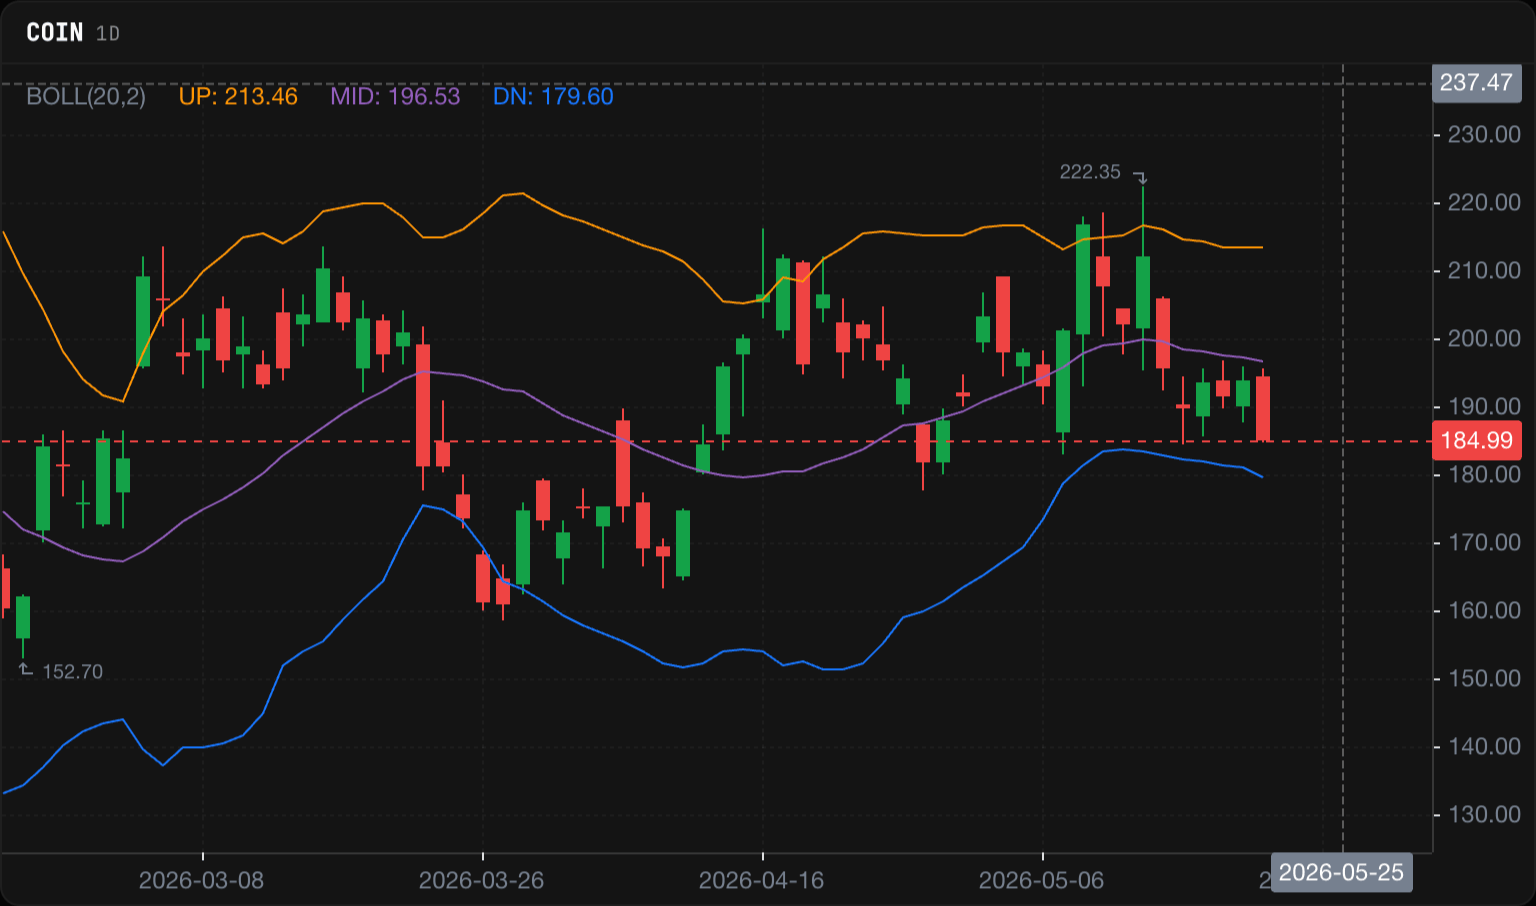
Bollinger Bands
How volatile price is relative to its recent average. The bands expand when volatility rises, contract when it falls.
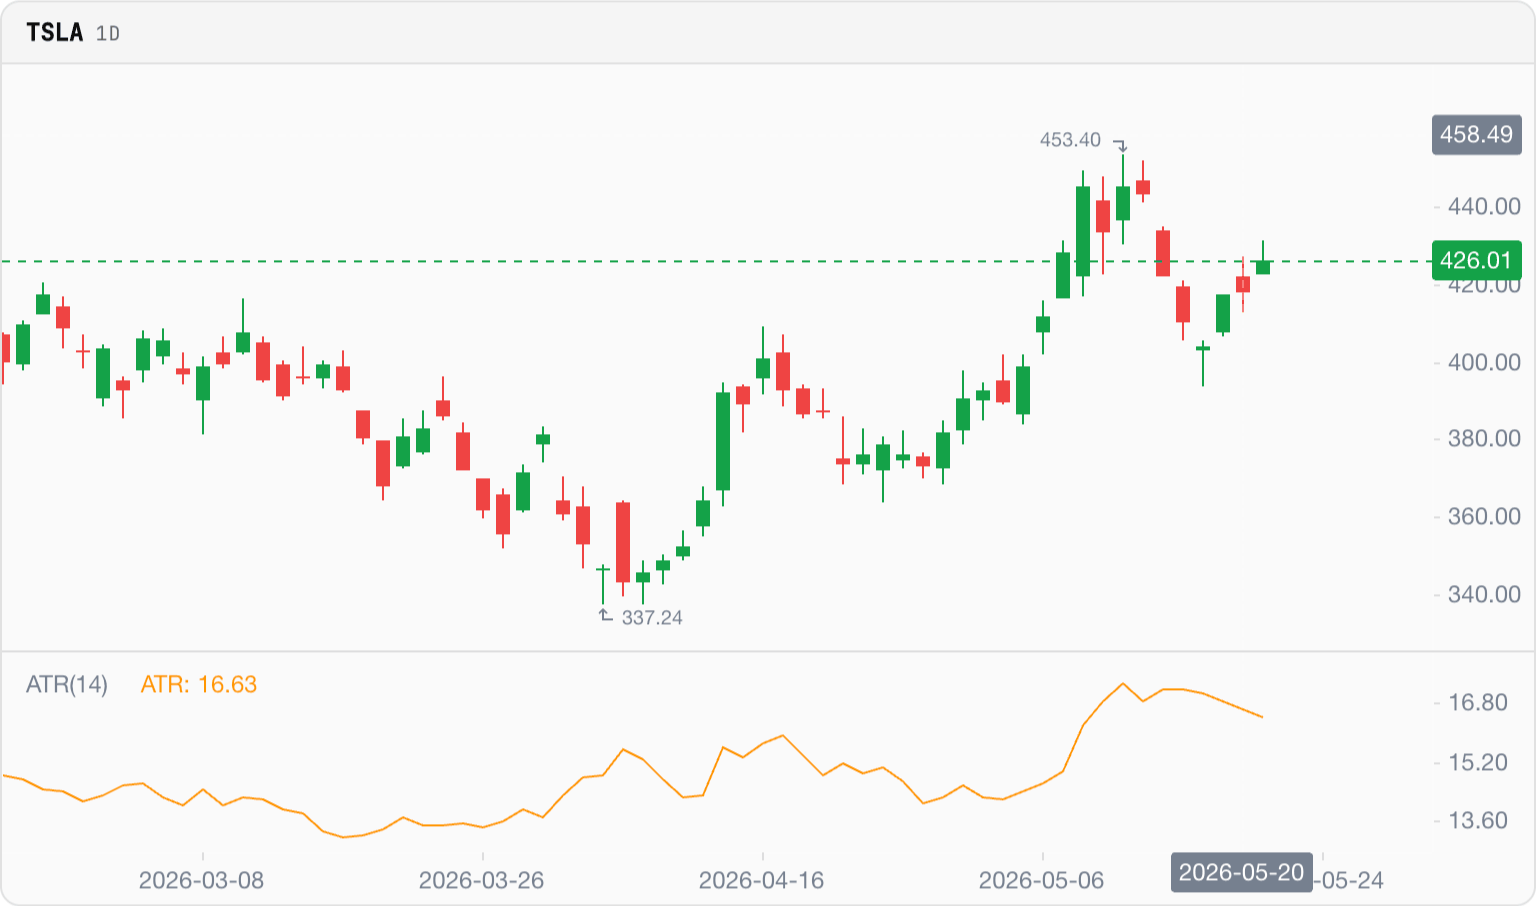
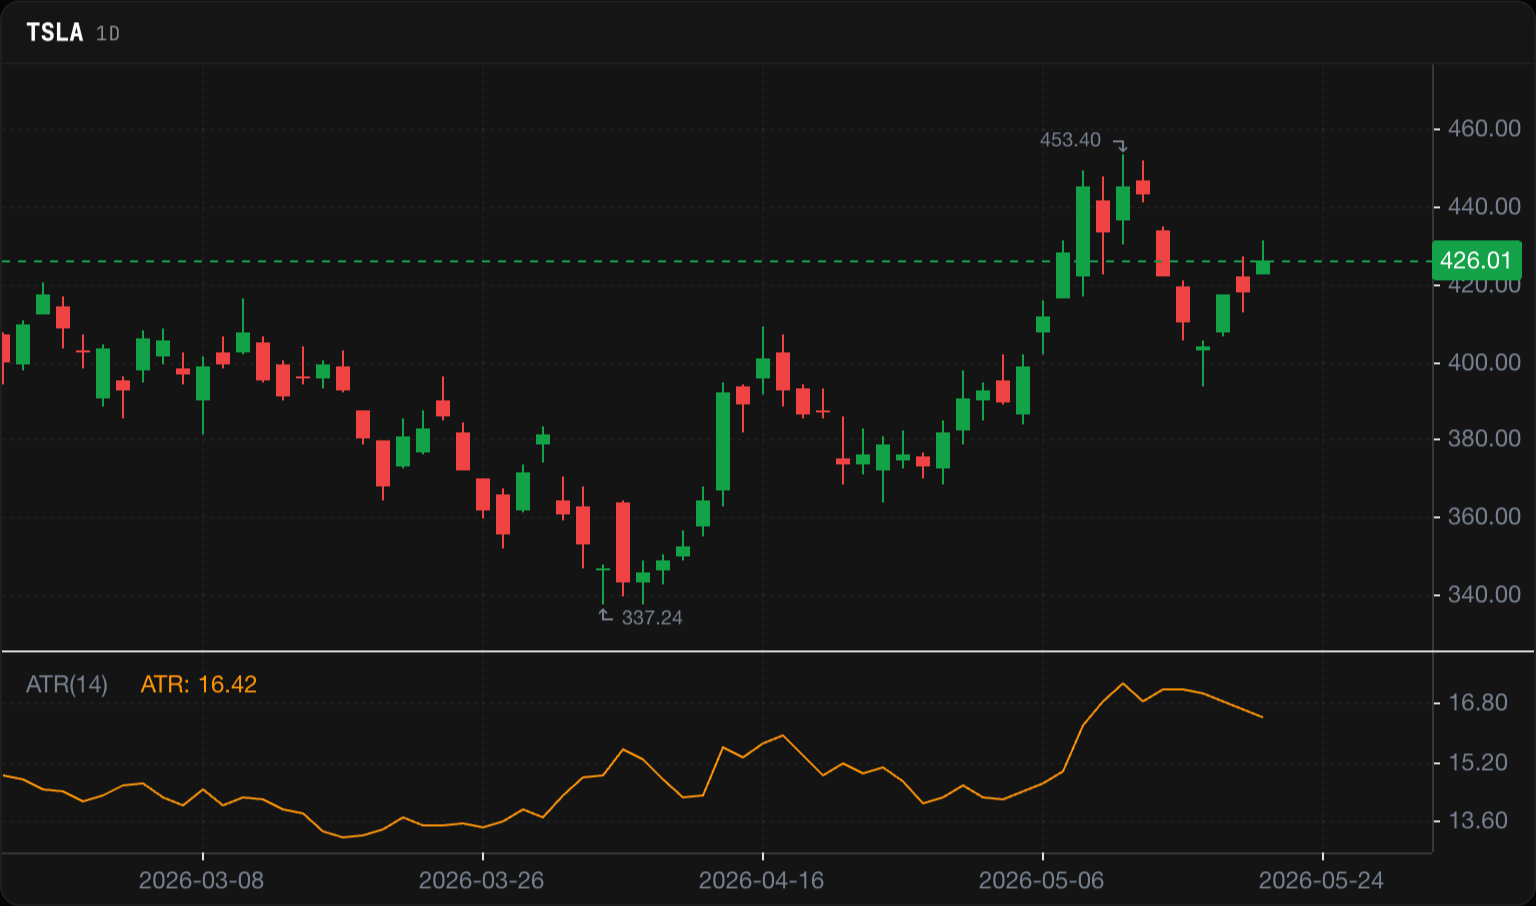
Average True Range
ATRThe average size of a price bar over the lookback period. Pure volatility measurement - no direction, no trend, just typical movement.
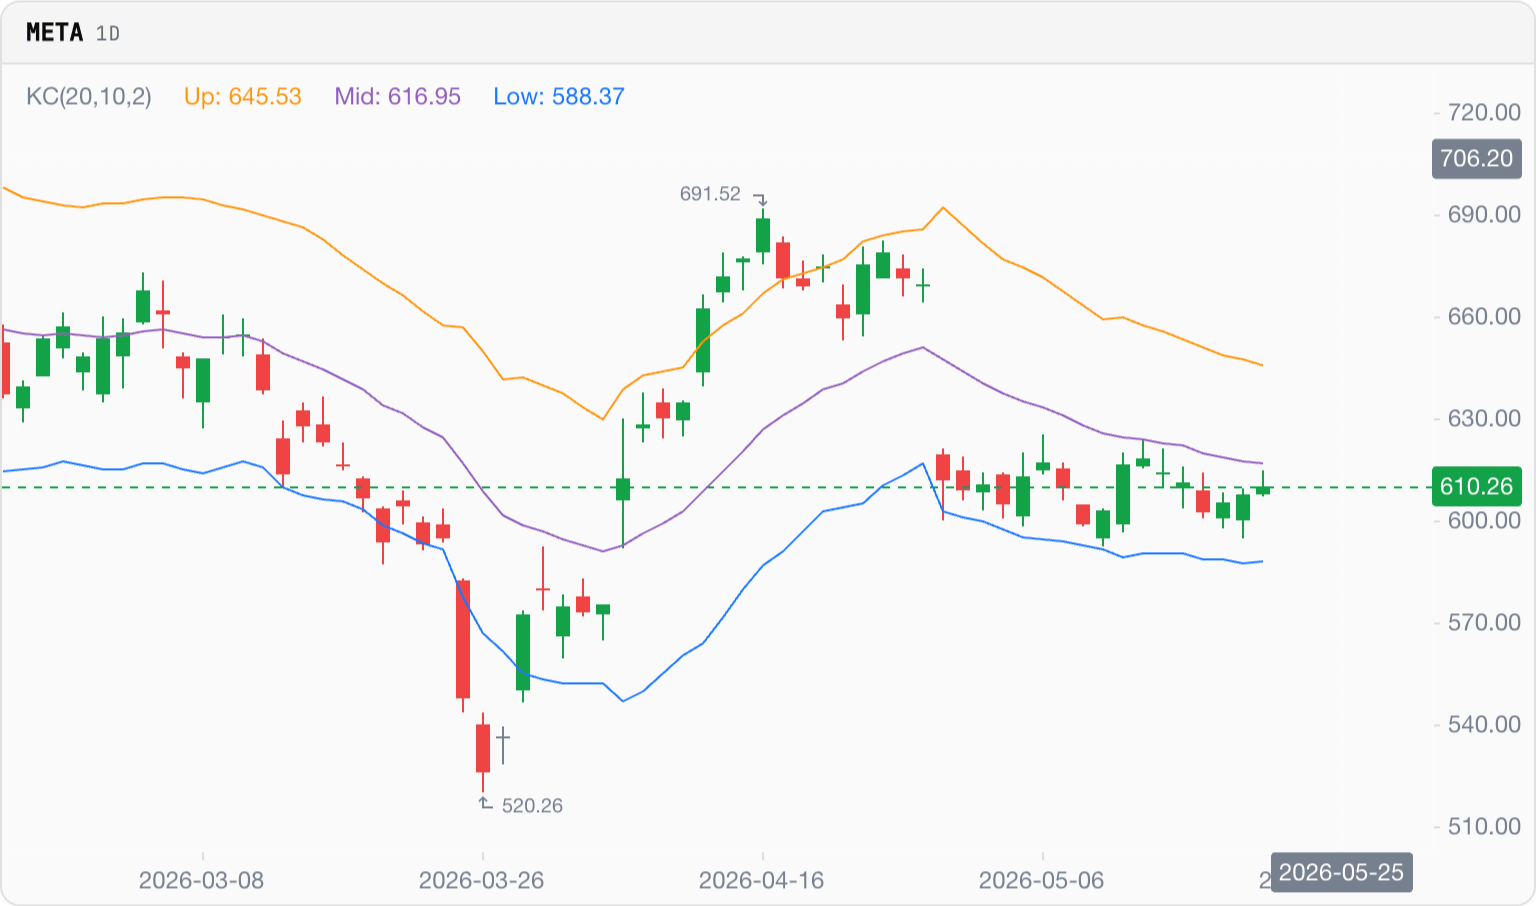
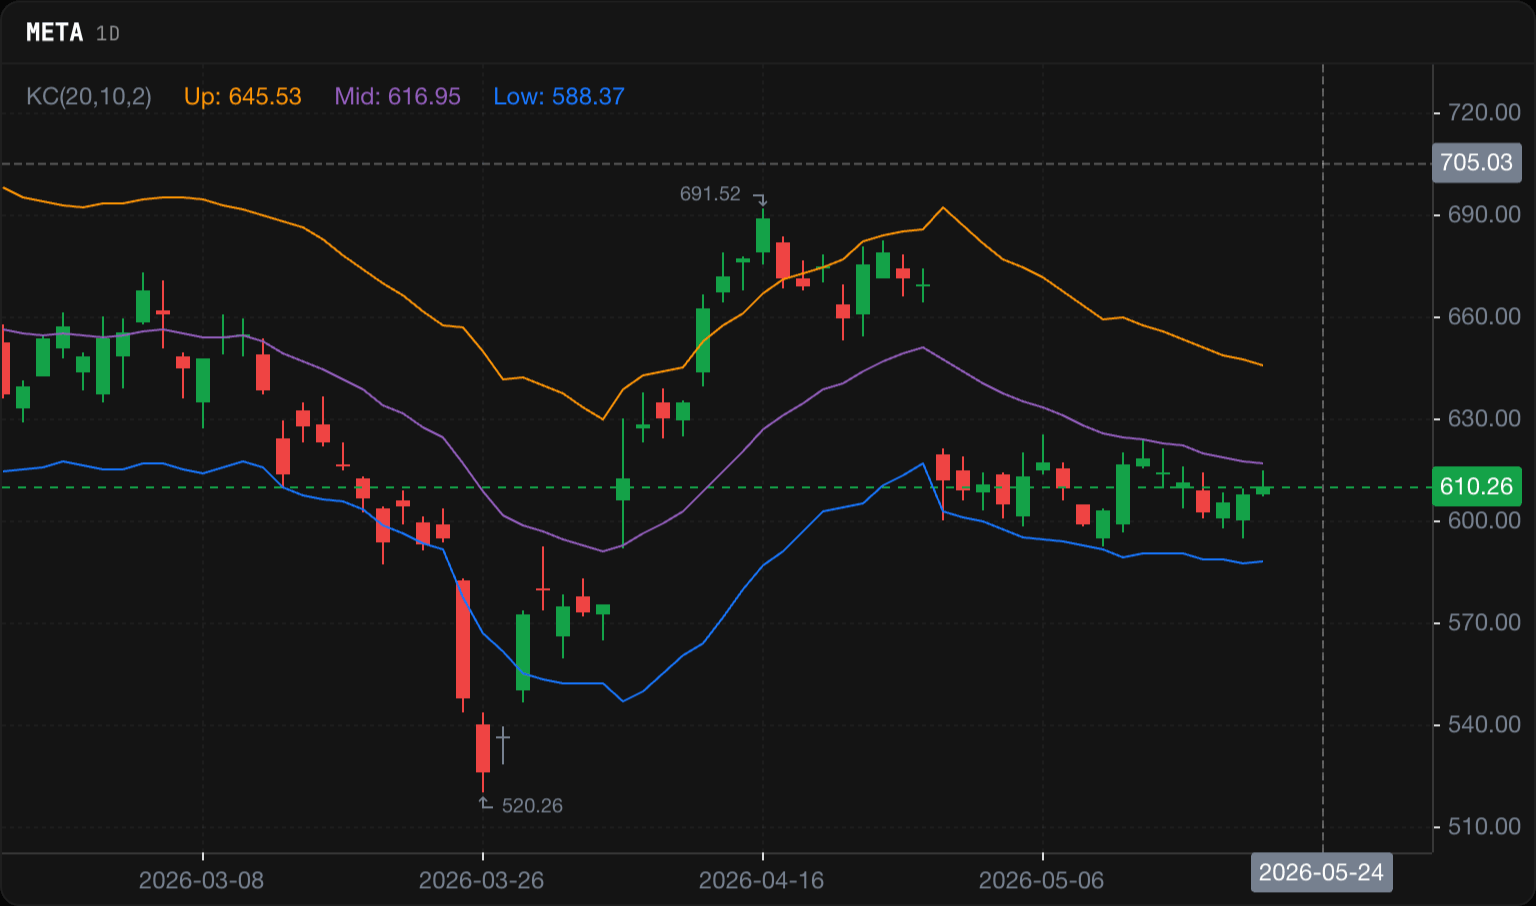
Keltner Channels
An EMA wrapped in ATR-derived envelopes. Similar idea to Bollinger Bands but built from ATR rather than standard deviation - smoother in noisy markets.
Volume
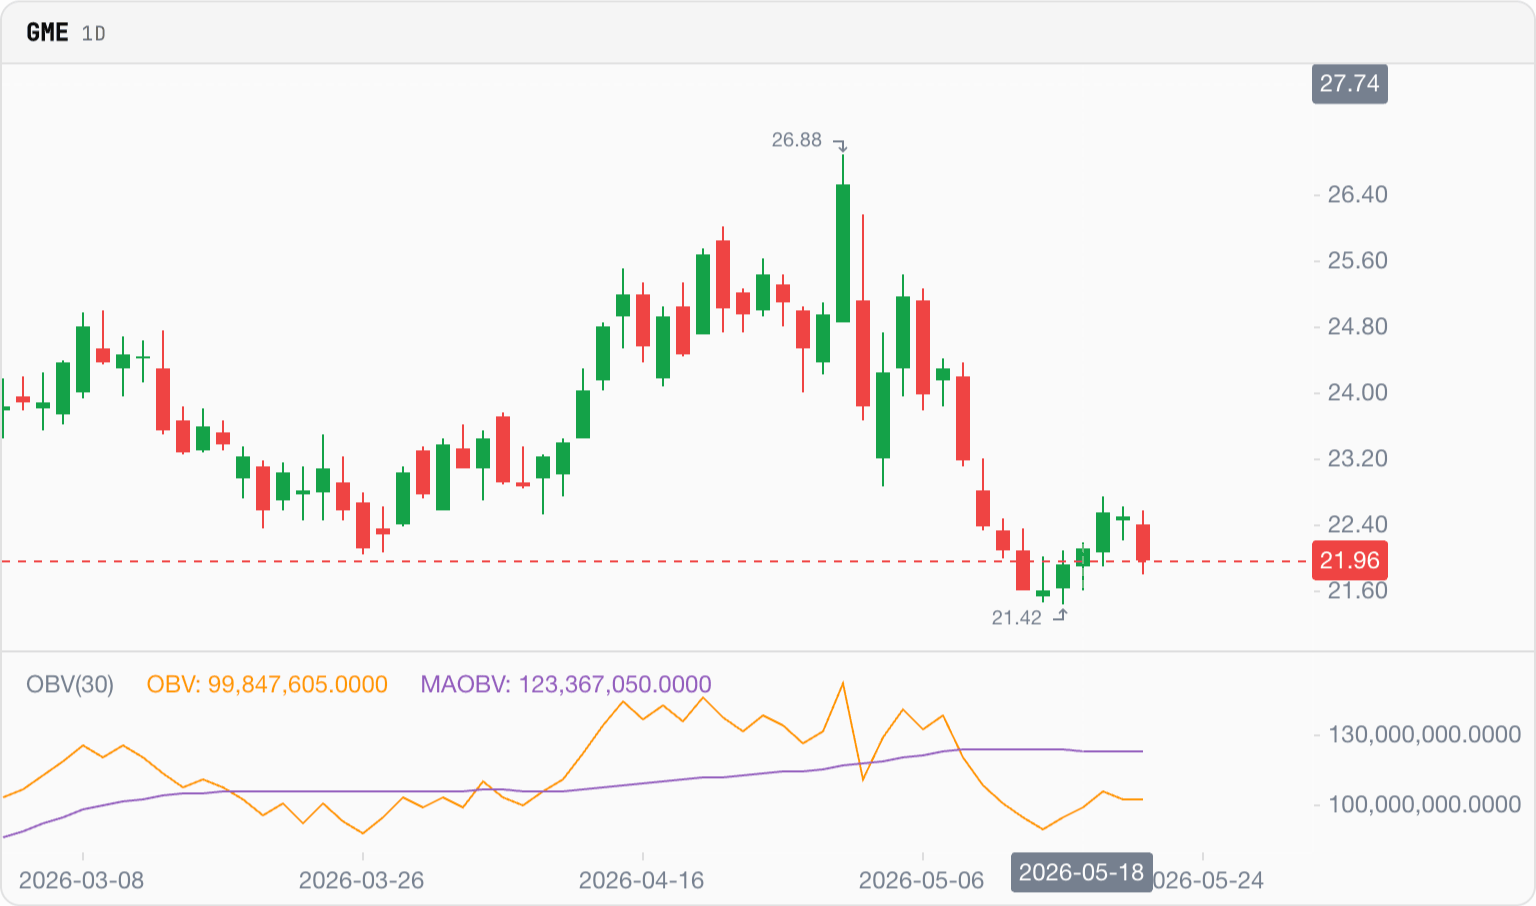
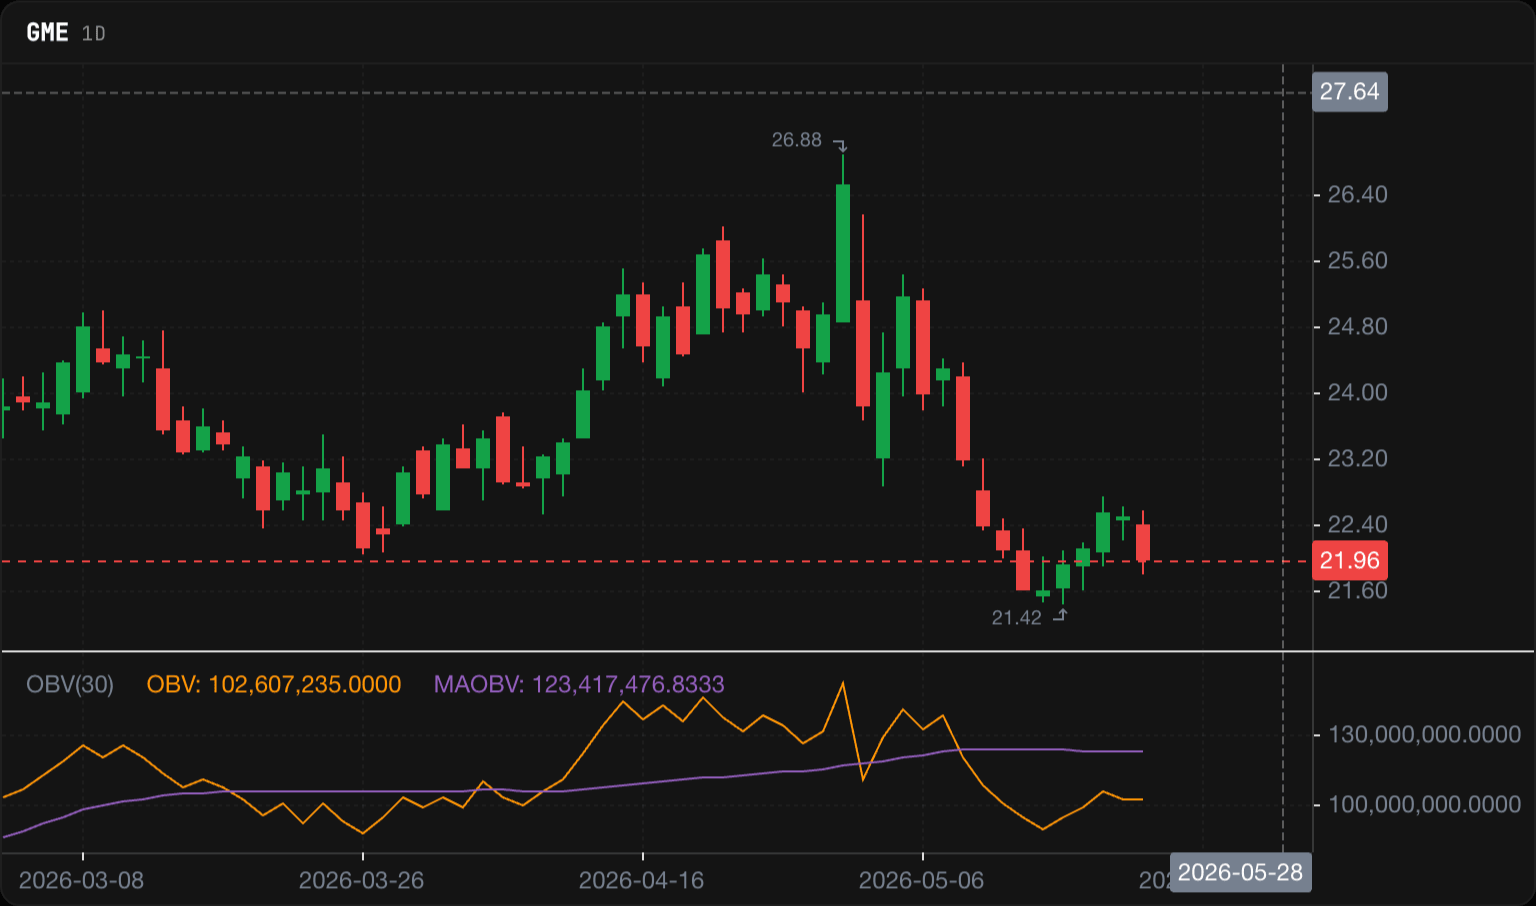
On-Balance Volume
OBVA running total of volume, signed by the direction of each price change. Aims to show whether volume is accumulating into rallies or selling into declines.
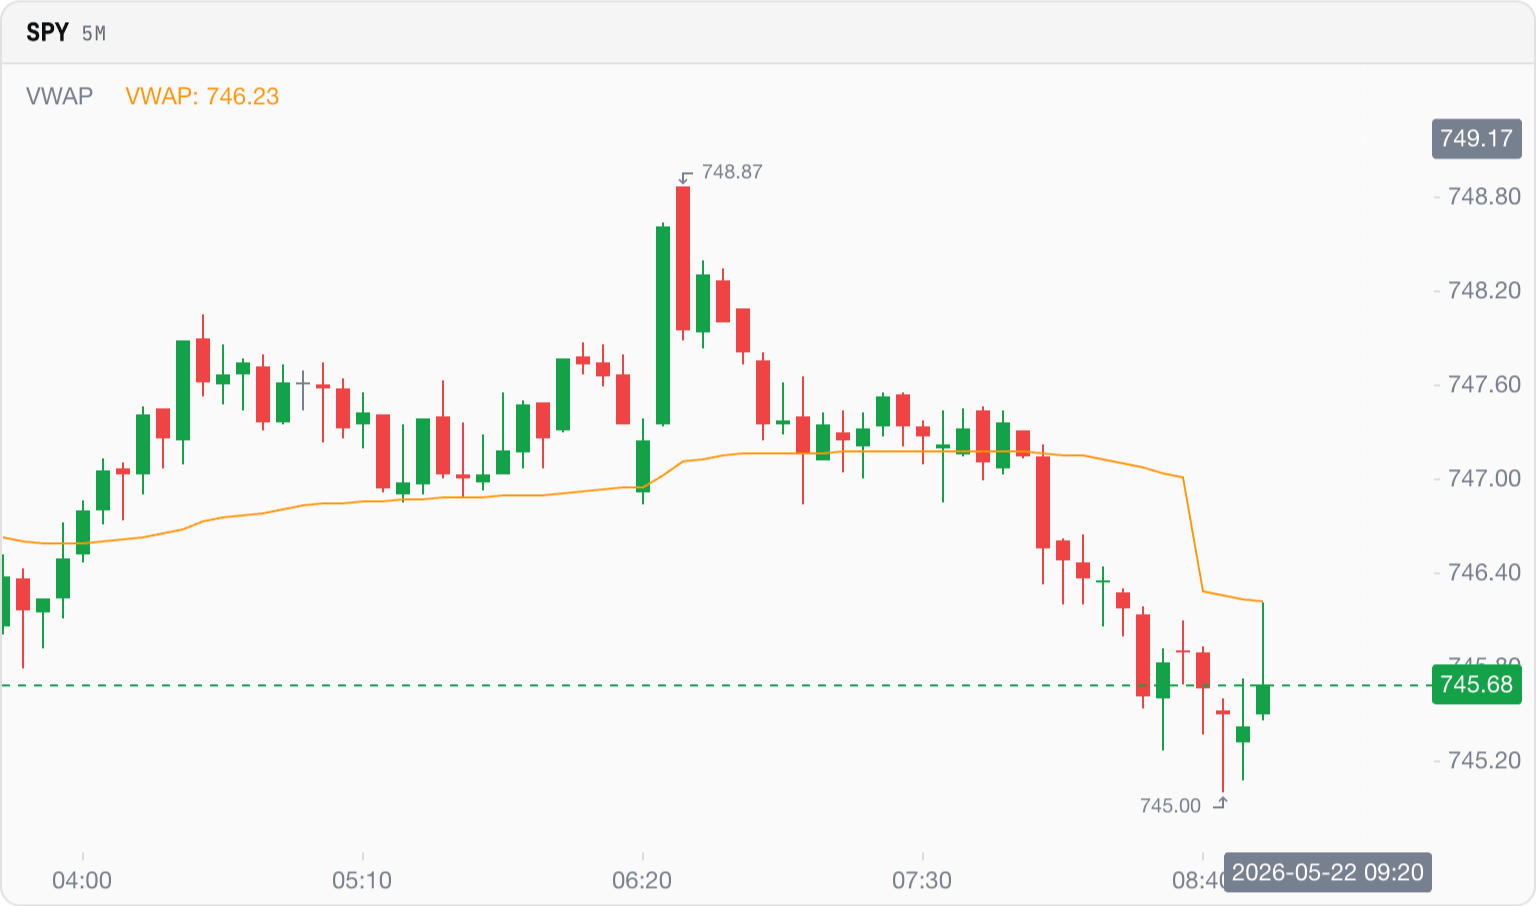
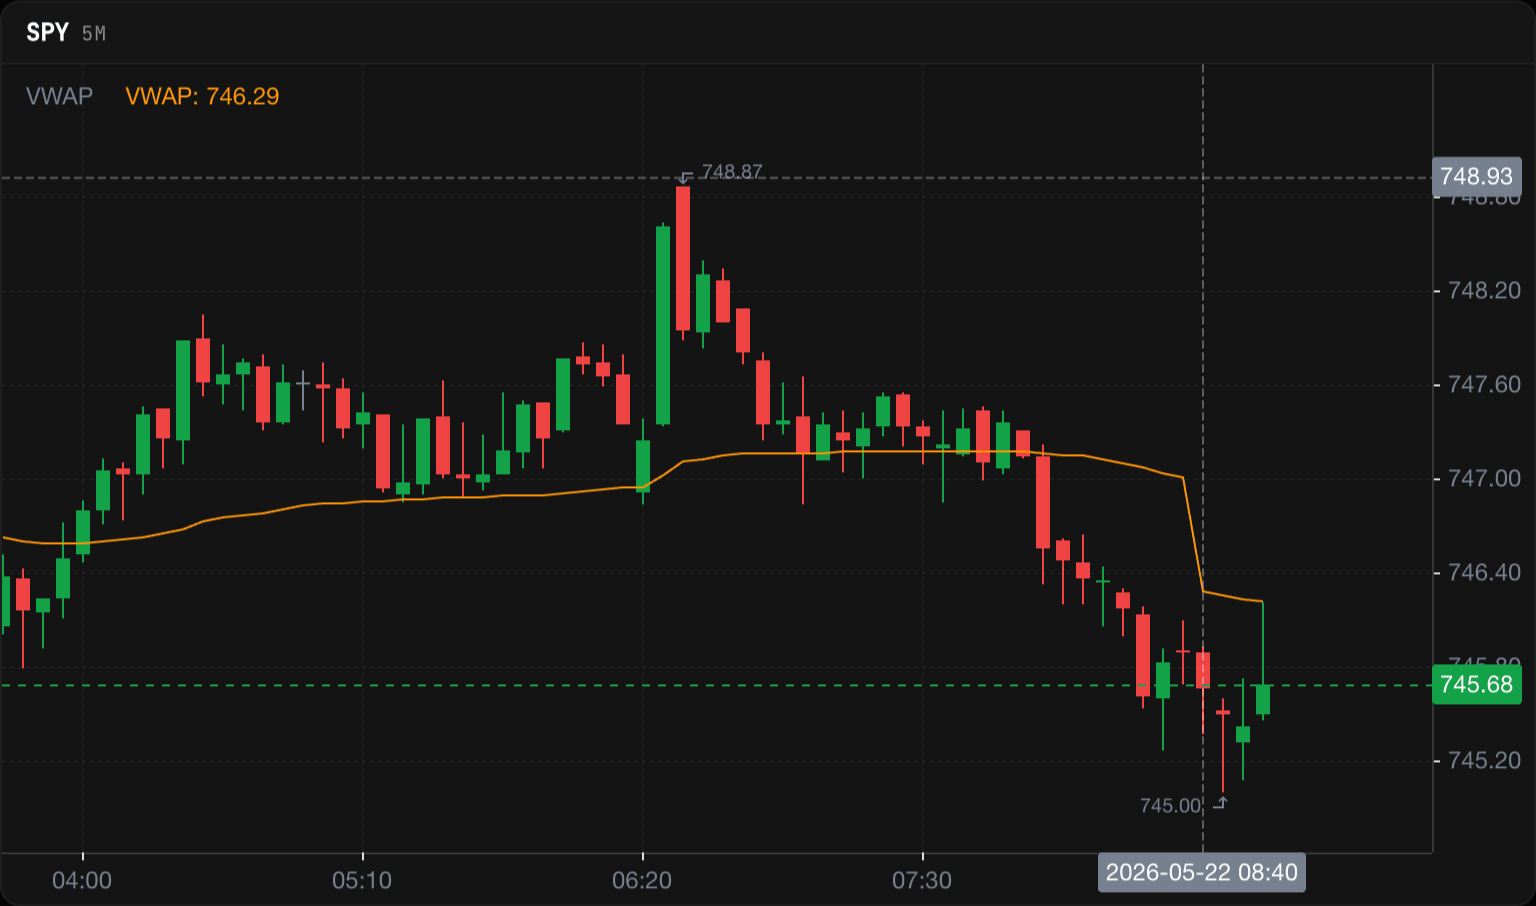
Volume Weighted Average Price
VWAPThe average price weighted by volume traded at each price, calculated from the session open. The reference price every institutional desk benchmarks against.
Money Flow Index
MFIRSI weighted by volume. Same 0-to-100 scale, same overbought / oversold levels, but heavy-volume bars count more than thin ones.
Accumulation / Distribution Line
A/DA volume-weighted gauge of whether each bar's price action reflects buying pressure (close near the high) or selling pressure (close near the low).